

Curated Travel
The Dorian List
National Park System: The Biggest Category Is the Emptiest

Co-Founder & Travel Advisor, Dorian Destinations · Published November 2, 2026 · ET
Plan a trip around the empty half →
There are 86 National Monuments in the United States and 64 National Parks. The monuments are the larger group in the national park system by some margin. They take six per cent of the visits.
That one comparison is the whole argument of this piece, and it comes out of a table the National Park Service publishes every year that almost nobody reads. The agency breaks its visitor numbers down by the kind of unit people went to — park, monument, memorial, parkway, seashore and so on — and the resulting distribution looks nothing like the way the system is talked about.
The word everyone uses is “park.” The national park system itself is 434 units across more than 85 million acres, and the units called National Parks are a minority of them.
Every figure below comes from the National Park Service’s own published pages, each linked at the foot of the article: the 2025 visitor-use summary, the system unit list, the designation definitions and the visitor-counting FAQ. Where we have divided one national park system number by another — share of visits against share of units — we say so in the sentence, because that arithmetic is ours and not theirs.
What we are not doing is ranking these national park system units by quality. The National Park Service does not publish a quality ranking and neither will we. The order below is the order of the visit-share table, nothing more, and where we recommend going somewhere that is our judgment and is labelled as such. We are travel advisors, not rangers, and we hold no permits, no campsite allocation and no commercial-use authorisation inside any unit named here.
One honest caveat before the list, and it is the agency’s own. The NPS counts a recreation visit as the entry of a person onto NPS land or water, once per person per day. Large parks often count vehicles and apply a people-per-vehicle multiplier that varies by park, by season and by vehicle type, and remote areas are estimated mathematically from counts taken somewhere more accessible. These are good numbers. They are not turnstile numbers.
“The entry of a person onto lands or waters administered by the NPS.” — the National Park Service’s published definition of a recreation visit, counted once per person per day however many times they come and go
What the national park system actually counted in 2025
Total national park system recreation visits came to 323 million, down 8.85 million on the year — a drop of 2.7 per cent from 2024, which had been the record at 331,863,358. Recreation visitor hours came to 1.39 billion, down 0.7 per cent, and overnight stays fell 2.4 per cent. Of the units in the national park system, 406 report visitor use at all; the rest are too new, too undeveloped or administered by somebody else.
And yet 26 parks — six per cent of those that report — set an all-time annual record in the same year the system as a whole went down. That is the shape of the national park system: a small number of places absorbing more and more, while the average unit quietly does not.
For scale, the first visitor figures were collected in 1904, when six national parks reported 140,954 visitors between them. Divide last year into that and the national park system now carries roughly two thousand three hundred times the traffic it was built to measure.
1. National Park — 29% of national park system visits, 64 units
The category everybody means. NPS defines a national park as a unit that “contains a variety of resources and encompasses large land or water areas” — big and diverse, in other words, rather than built around one thing. Sixty-four of them take 29 per cent of all recreation visits, which is roughly double their share of the national park system by unit count.
That concentration is the crowding problem in a sentence. It is not that American public land is full. It is that one designation, holding about a seventh of the units, absorbs nearly a third of the people, and within that designation the traffic concentrates again into a handful of names everyone can recite.
Best for: first-time visitors, and anyone who wants the scale that only a very large unit delivers.
Go when: outside the summer peak if you can — this is the one category where the arithmetic genuinely works against you.
2. National Recreation Area — 15% of visits, 18 units
The quiet giant. Only 18 units carry this designation and they take 15 per cent of all visits — close to four times their share of the system, the second-biggest over-performance in the national park system table. NPS explains why in its own definitions: recreation areas began as the land around reservoirs built by other federal agencies, and the category has since widened to include lands and waters set aside for recreation by acts of Congress, urban ones included.
That urban clause is the point. These are the units closest to where people actually live, which is why so few of them carry so much.
Best for: water, and for a day out rather than an expedition.
Go when: any weekday — proximity to cities means the weekend differential here is sharper than the seasonal one.
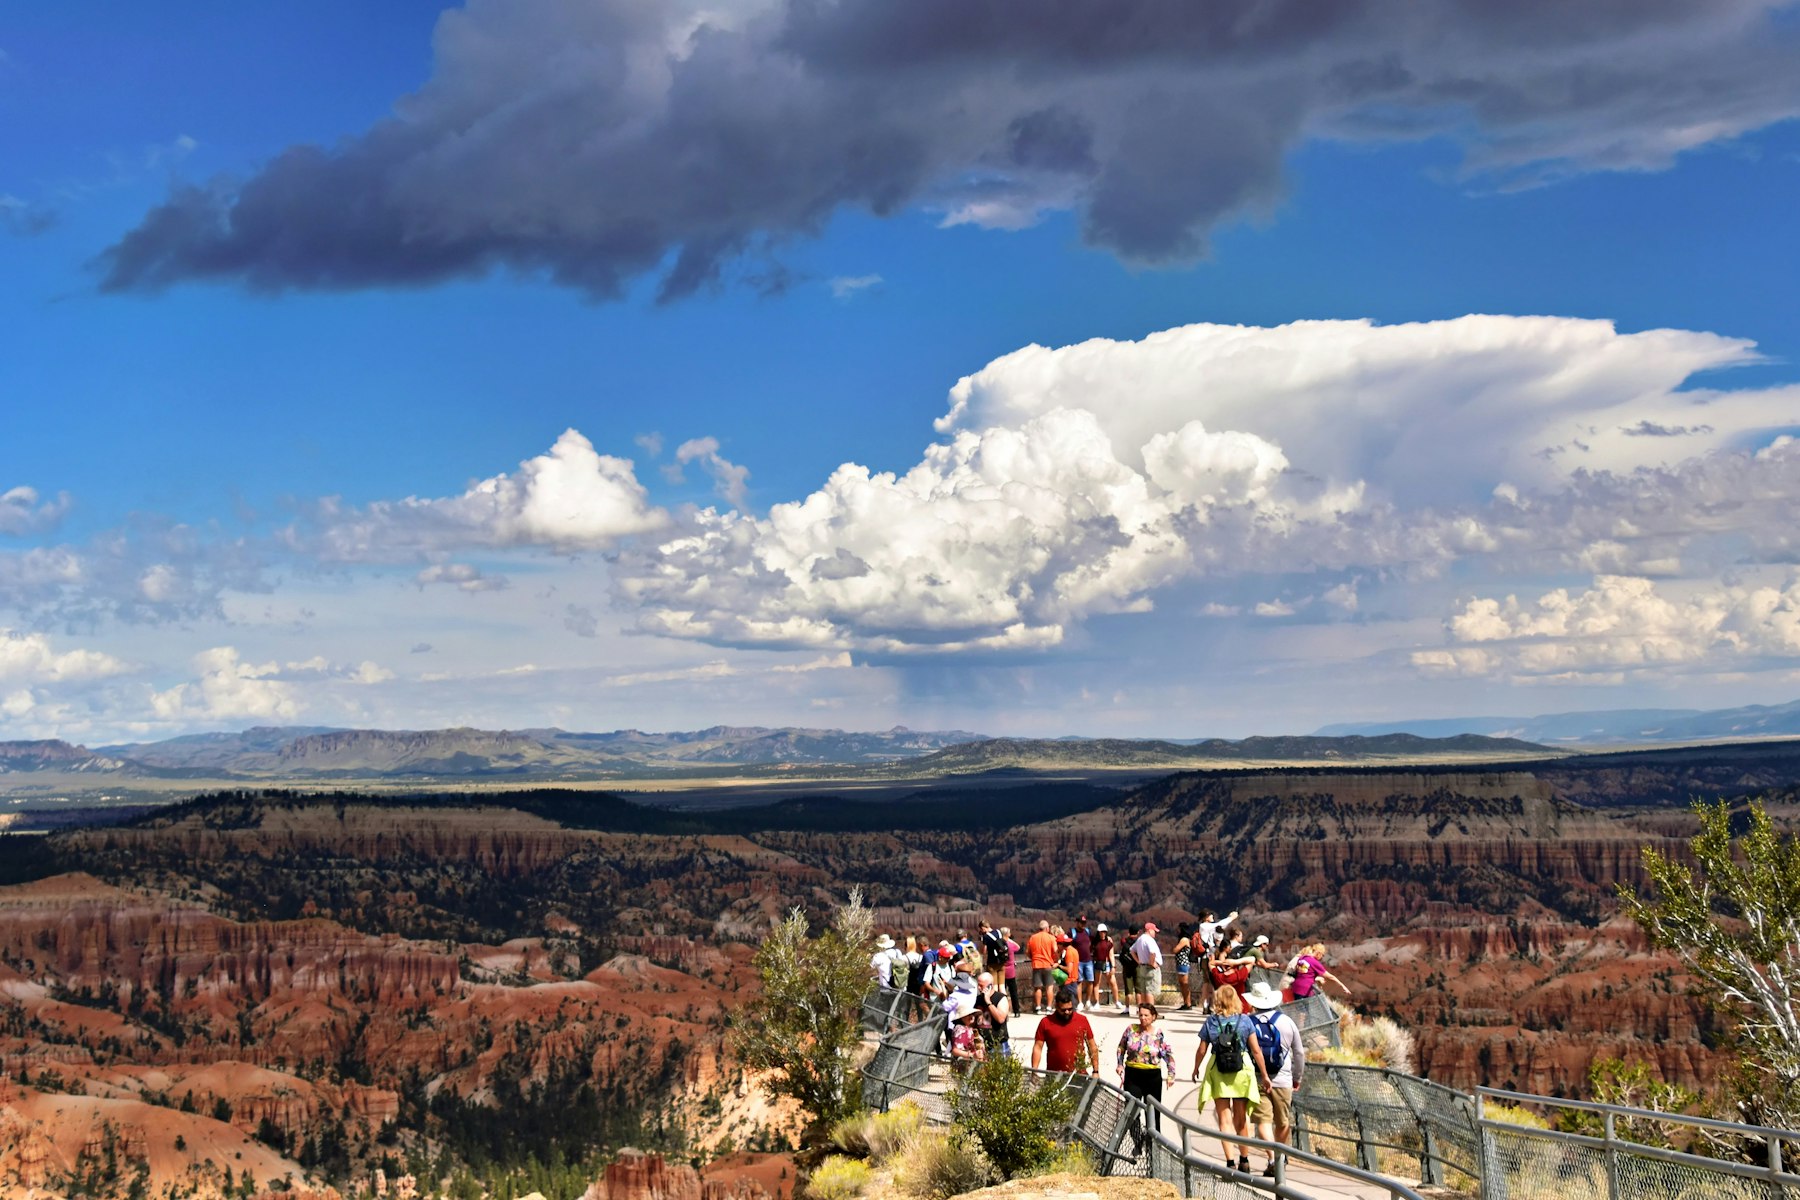
3. National Memorial — 11% of visits, 32 units
Thirty-two units, 11 per cent of visits, and a designation most people have never consciously registered. NPS calls a national memorial “primarily commemorative” and adds a detail worth holding onto: it need not stand on a site historically connected to its subject. A memorial is an argument about meaning rather than a protected piece of ground.
They are also, as a group, free, short and central — which is exactly why eleven per cent of a 323-million-visit system passes through them.
Best for: a morning rather than a day, and for travellers who want the history without the drive.
Go when: early. These are the units where the light and the quiet both go first.
4. National Parkway — 10% of visits, 4 units
Here is the strangest line in the table. There are four national parkways in the entire system and they take ten per cent of its visits. Measured against their share of the units, that is roughly eleven times their weight — by a wide margin the most over-subscribed designation in the national park system.
The definition explains it without quite excusing it. A parkway is “ribbons of land flanking roadways” built for scenic driving and explicitly not for speed. Every car that drives the length of one is a visit, which makes the parkway the easiest national park system unit to visit by accident.
Best for: anyone who wants the landscape at windscreen pace, and for linking two other units without a dull transfer.
Go when: autumn, on a weekday, and start early — our judgment, not a published figure.
5. National Historical Park — 9% of visits, 64 units
Exactly as many units as there are national parks, and under a third of the visits. NPS distinguishes a historical park from a historic site by scale: the park designation usually covers “greater physical extent and complexity.” Sixty-four of them, nine per cent of the traffic.
This is the first genuinely under-visited national park system category in the list, and the gap between its unit count and its visit share is the most straightforwardly actionable thing in the table. Same number of places as the famous designation. Less than a third of the people.
Best for: travellers who want somewhere to walk and something to think about in the same afternoon.
Go when: shoulder season, when the interpretive programmes still run but the school groups have gone.
6. National Seashore — 7% of visits, 10 units
Ten units, seven per cent of visits — a three-fold over-performance, and the smallest category in this list by unit count. NPS defines a seashore as protected coastal shoreline and offshore islands offering “water-oriented recreation,” and notes they sit on the Atlantic, Gulf and Pacific coasts.
The companion designation is a useful illustration of how small some of these categories are. National Lakeshores work the same way on freshwater, and there are three of them in the whole system.
Best for: anyone who assumed the national park system did not hold the protected coast.
Go when: September, for warm water without August company — our judgment.
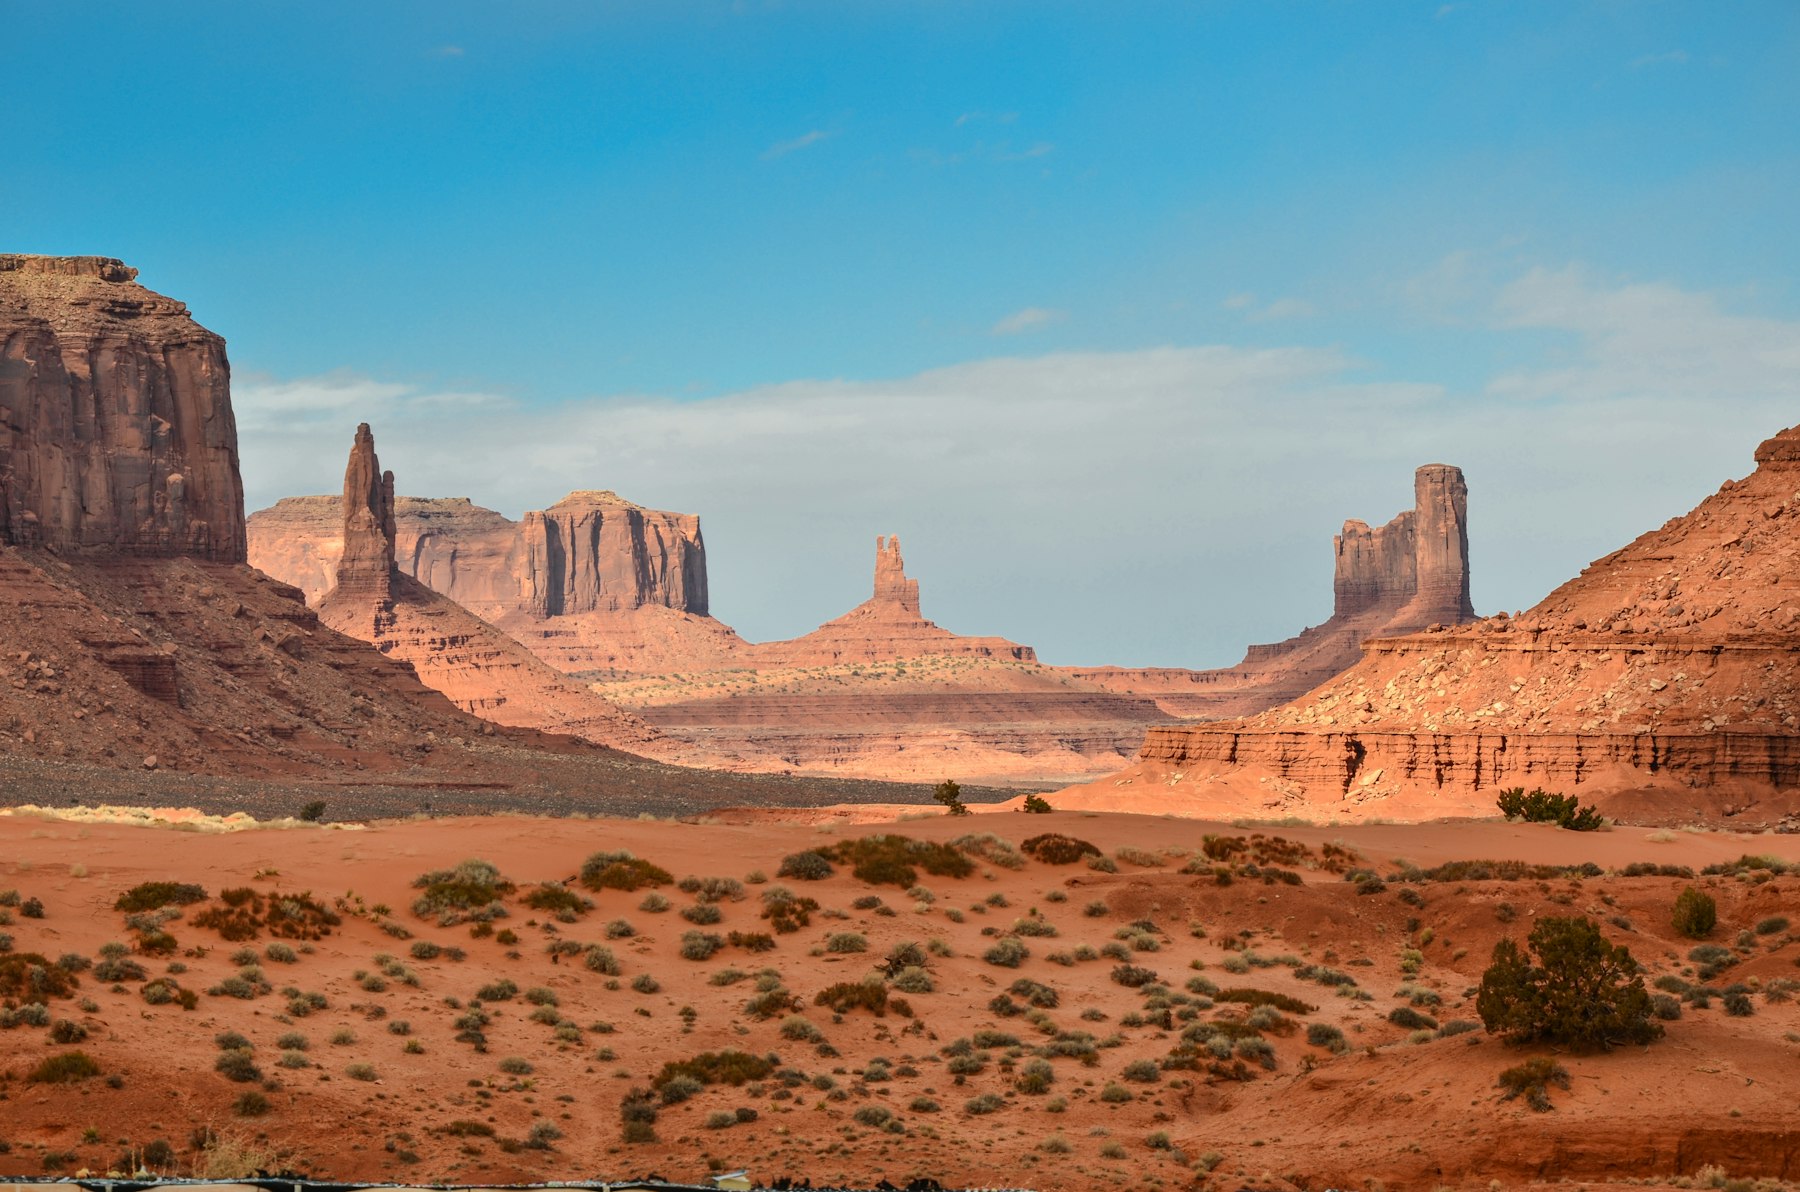
7. National Monument — 6% of national park system visits, 86 units
And here is the finding worth the whole article. National Monuments are the largest single designation in the system — 86 units, about a fifth of everything the NPS administers — and they take six per cent of the visits. Measured against their share of the units, that is under a third of their weight: the biggest category in the national park system is, by this measure, its emptiest.
The definition tells you why, and it is not a criticism of the places. A monument is created to preserve “at least one nationally significant resource,” and NPS says plainly that it is typically smaller than a park and offers fewer attractions. One thing, protected properly, with less built around it.
Which is the argument for going. If what you want from public land is a view without a queue at it, the arithmetic above says the monuments are where the room is, and there are more of them than of anything else. Eighty-six units sharing six per cent of 323 million visits is not a scheduling problem. It is an invitation nobody has opened.
We would add one practical note: fewer attractions usually means fewer facilities. Smaller visitor centres, shorter seasons, sometimes no water. The emptiness is real and so is the reason for it.
Best for: repeat visitors who have done the famous five and want the opposite experience.
Go when: any time you would otherwise have queued — and check opening hours first, because they are shorter than you expect.
| Designation | Units | Share of 2025 visits | Visits vs size |
|---|---|---|---|
| National Parkway | 4 | 10% | About eleven times its share of units |
| National Recreation Area | 18 | 15% | Close to four times |
| National Seashore | 10 | 7% | About three times |
| National Memorial | 32 | 11% | Around one and a half times |
| National Park | 64 | 29% | Roughly double |
| National Historical Park | 64 | 9% | Under two thirds |
| National Monument | 86 | 6% | Under a third |
Unit counts and visit shares are the National Park Service’s own published figures for 2025. The right-hand column is our arithmetic — share of visits divided by share of the system’s 434 units — and is not a figure NPS publishes. Smaller designations are omitted; percentages do not sum to 100.
How to use the national park system table when you plan
Three moves, in order, and none of them takes longer than an evening.
Search the designation, not the place
Most trip planning starts with a name. Start with a category instead: pick the designation that matches what you actually want — water, history, a drive, a view with nobody in it — and then find the units near your route that carry it. The NPS unit list is organised exactly this way, by designation and count, which makes it a better planning document than any top-ten article.
Check whether the unit reports at all
Only 406 of the national park system’s units report visitor use. If a place you are considering has no published figures, that is not a data gap to worry about — it usually means the unit is new, still acquiring land, or has no permanent staff yet. Treat it as a signal about facilities rather than about quality.
Read the monthly numbers, not the annual ones
NPS publishes preliminary monthly data by about the fifteenth of the following month, and parks can edit it until the year is finalised in the first quarter. For anyone trying to dodge a crowd, last month’s figure for the unit you are considering is worth far more than last year’s headline, and it is free.
See how we build a trip around capacity →
Frequently Asked Questions
How many units are in the national park system?
The National Park Service gives two figures on its own site. Its unit list page counts 434 units by designation, and its FAQ and 2025 visitor-use summary both refer to 433. We have used 434 where we divide, because that is the page that itemises them, and flagged the discrepancy rather than quietly picking one.
How many national parks are there in the United States?
Sixty-four units carry the National Park designation specifically. That is distinct from the national park system as a whole, which is more than four hundred units across twenty designations and over 85 million acres. Most places people call national parks are something else.
What is the difference between a national park and a national monument?
NPS defines a national park as containing a variety of resources across large land or water areas. A national monument preserves at least one nationally significant resource, is typically smaller, and offers fewer attractions. The practical difference for a visitor is usually facilities and crowds, not scenery.
Which national park system units are least crowded?
By share of visits against share of units, National Monuments are the emptiest large category: 86 units taking six per cent of 2025 visits. National Historical Parks are the next most under-visited, with the same number of units as the national parks and under a third of the traffic.
Are national park visits going up or down?
Down slightly, for now. The 2025 total was 323 million recreation visits, 2.7 per cent below the 2024 record of 331,863,358. But 26 parks set their own annual records in the same year, so the system-wide fall does not mean any particular place got quieter.
The Dorian Destinations Verdict
Stop planning around the word and start planning around the table. The national park system is not short of space; it is short of distribution. One designation in twenty takes nearly a third of the people, and the largest designation of all takes six per cent.
So the advice is unambiguous, and it costs nothing to follow. If you have been to the famous names and came home saying it was beautiful but busy, you have not exhausted the national park system — you have visited one category of it. Go and look at the 86.
And if you only take one number away, take the parkways: four units, ten per cent of the visits. Whatever else that table says, it says the easiest way into the national park system is still a road, and that most people are arriving somewhere without ever deciding to.
Sources: National Park Service, 2025 visitor use statistics; visitation numbers; the National Park System unit list; park designations explained; visitor use statistics FAQ; the science of visitation. Visit shares and unit counts are the agency’s; the visits-against-size column is our own division and is labelled as such. Related Dorian reading: trekking tours and bed capacity, what a park register leaves out and booking a walk around its huts.
Best of Travel · National Parks · United States · Cultural Travel